

MARKET UPDATE: 2-20-2024
Week of February 12, 2024 in Review
Wholesale and consumer inflation were both hotter than expected in January. There was also a pullback in new home construction, though home builders are feeling confident about the year ahead. Here are last week’s headlines:
- Consumer Inflation Above Forecasts
- Hot Wholesale Inflation a Surprise
- Home Builder Confidence at 6-Month High
- Home Construction Slowed in January
- Retail Sales Tumble to Start the Year
- Challenges Remain for Job Seekers
Consumer Inflation Above Forecasts
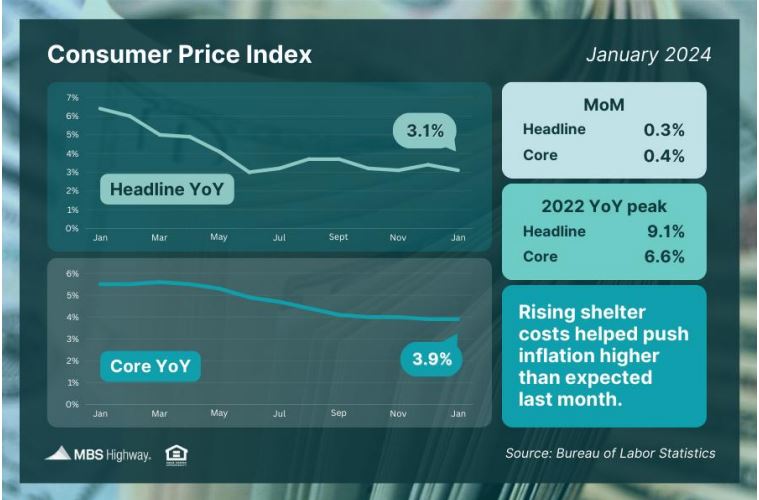
The latest Consumer Price Index (CPI) showed that inflation rose 0.3% from December to January, coming in hotter than economists had expected. On an annual basis, CPI fell from3.4%to 3.1%, not quite as low as forecasted but still a move in the right direction.
Core CPI, which strips out volatile food and energy prices, increased 0.4% while the annual reading remained at 3.9%. Both figures were slightly higher than estimates.
Rising shelter, motor vehicle insurance and medical care service costs helped push inflation higher last month. However, shelter costs have been moderating based on other reports, which should help inflation cool further once the reporting catches up.
What’s the bottom line?
Even though the latest inflation numbers were hotter than expected, inflation has made significant progress lower after peaking in 2022. The headline reading is now at 3.1% (down from 9.1%), while the core reading is at 3.9% (down from 6.6%).
Hot Wholesale Inflation a Surprise
The Producer Price Index (PPI), which measures inflation on the wholesale level, rose0.3% in January, coming in above the expected 0.1% rise. On an annual basis, PPI fell from 1% to 0.9% and while this is a very low number, it was expected to fall to0.6%. Core PPI, which strips out volatile food and energy prices, was much hotter than expected with a 0.5% rise. The year-over-year reading rose from 1.8%to 2%.
What’s the bottom line?
Despite the upside surprise in the data, wholesale inflation is still trending lower. January’s 0.9% year-over-year reading is a sharp drop from 2022’s 11.7% peak.
Remember, the Fed began aggressively hiking the Fed Funds Rate (the overnight borrowing rate for banks) in March 2022 to try to slow the economy and curb run away inflation. Following eleven hikes in this cycle, the Fed has pressed pause at their last four meetings as signs of cooling inflation grew.
The Fed is expected to begin cutting the Fed Funds Rate later this year, given the progress made to tame inflation. We will have to see if these hotter than expected readings for January ultimately impact the timing of
Home Construction Slowed in January
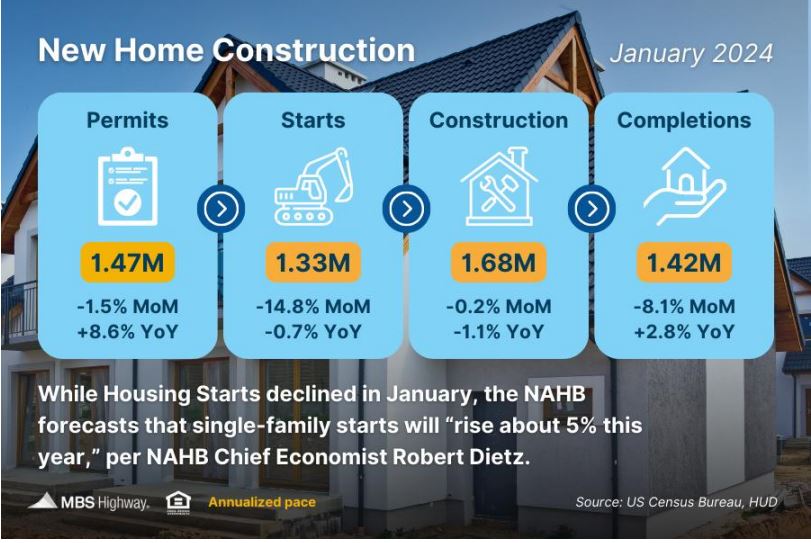
Housing Start shit a five-month low in January, down a sharp 14.8%fromDecember. While the bulk of the decline was in multi-family projects, single family starts also ticked lower.
However, the NAHB predicts that “single family starts will rise about 5% this year,” per their Chief Economist, Robert Dietz, and there are already signs to support this forecast. Single-family Building Permits (which reflect future construction) were at their highest level in a year, up a whopping 35.7% when compared to January 2023.
What’s the bottom line?
“Moderating mortgage interest rates in 2024 will ultimately lead to gains for single-family home building this year,” said NAHB Chair Alicia Huey.
Given the persistent low supply of available homes for sale, more inventory is welcomenews for buyers around the country, though there is still a long way to go for supply to catch up with demand. The pace of completed homes that will be coming to market is now around 1.4 million homes annualized, and then we must subtract roughly 100,000 homes that need to be replaced every year due to aging. This puts us well below demand as measured by household formations that are trending at almost 1.7 million as of the end of December.
More demand than supply will continue to be supportive of home values, especially if mortgage rates decline during the busier spring homebuying season.
Home Builder Confidence at 6-Month High
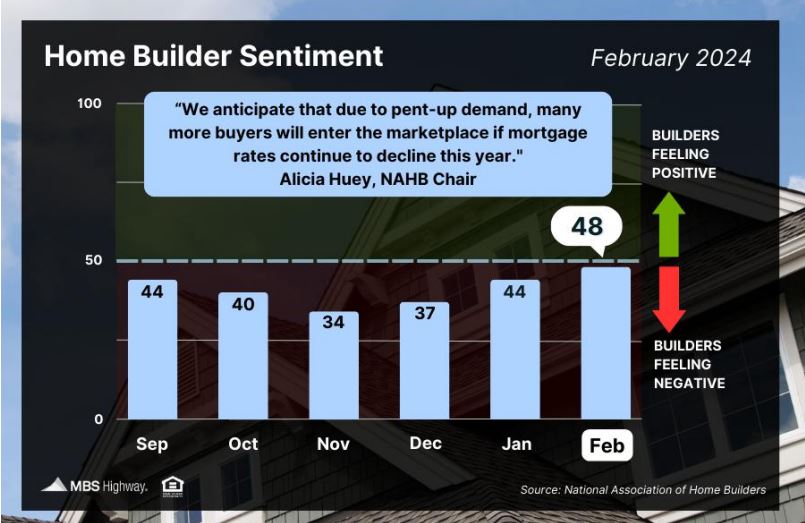
Sentiment among home builders rose for the third straight month in February, reaching the highest level since last August per the National Association of Home Builders(NAHB). Their
Housing Market Index climbed four points to 48 and while this is still in contraction territory, the reading is just shy of the key breakevenlevel
of 50. Any score over 50 on this index, which runs from 0 to 100, signals that more builders view conditions as good than poor.
All three index components posted gains this month, with current and future sales expectations now both in expansion territory while buyer traffic also moved higher.
What’s the bottom line?
While signed contracts on existing homes were soft last
month, that’s not the whole story. It takes time for the impact of lower rates to translate into buyers shopping, finding a home, negotiating, and eventually signing a contract. NAR’s Chief Economist, Lawrence Yun, confirmed that “current lower, falling mortgage rates will no doubt bring buyers into market,” which means the volume of signed contracts will likely rise in the months ahead.
Retail Sales Tumble to Start the Year
Retail Sales fell 0.8% from December to January, coming in well below forecasts and breaking a two-month streak of increases. Sales were 0.6% higher when compared to January 2023.
What’s the bottom line?
After a strong holiday shopping season, spending declined in a variety of categories to start the year, including gasoline stations, home improvement stores and online retailers. Some of the pullback in January could be a natural lull in spending after consumers ramped up purchases and took advantage of holiday discounts late last year. The use of credit cards or buy now pay later programs could have also contributed to slow spending in January as debts are now being repaid.
The Fed will be watching this data closely, as the strength of our economy will impact their monetary policy decisions, and it will be important to see if Retail Sales pick up as we move ahead this year.
What to Look for This Week
After the market closures Monday for Presidents Day, the minutes from the Fed’s latest meeting will be released Wednesday and these always have the potential to be market moving. Plus, more housing news will be reported Thursday via January’s Existing Home Sales, along with the latest Jobless Claims.
Technical Picture
Mortgage Bonds broke beneath the 100.427 Fibonacci level after Friday’s hotter than expected wholesale inflation data, ending last week sitting right on the next floor at their200-day Moving Average. The 10-year broke above 4.25% and has room to move higher before reaching a ceiling of resistance at its 100-day Moving Average.